
Published:
Sunday, February 20, 2022By now most of us have heard that “crime is skyrocketing in WA.” This claim is being used to justify the need to roll back the police reforms that the state Legislature enacted last year.
Scary, right?
But … is crime really rising in WA? The short answer: the evidence doesn’t support this claim.
Let’s take a closer look at the data.
1. First up: The statewide data for 2021 is not yet available.
Why is this?
Because there is a long process of collecting the data from all law enforcement agencies around the state, organizing it, and making it available to the public. (See more details in the “Data Appendix” section at the end of the blog.)
This means no one can say yet what happened to crime rates in Washington State in 2021. When someone claims otherwise, you should ask them what data they are referring to.
2. “But, don’t we know that crime rose last year? I’m sure I saw that in the news.”
The uptick that made the news last year happened in 2020, over a year before the police reform legislation took effect. (Remember, there is a long lag in reporting crime rate data for the state, so in 2021 we were hearing about data from 2020).
So what did 2020 look like? (see Figure 1)
Figure 1. WA State Crime rates
And what can we see from these jurisdictions? (see Figure 2)
Bottom line: There is no evidence that crime is “skyrocketing” in Washington State.
Data for 2021 are limited to the jurisdictions that provide public access to the data before they are published by the sources above.We found 5 such jurisdictions in WA state:
1. King County – The KC Prosecuting Attorney releases monthly data on felony referrals.
2. Seattle Police Department – releases quarterly summary data on crimes (downloadable).
3. Spokane City Police Department – releases monthly “Compstat” pdf reports online.
4. Spokane County Sheriff’s office – releases monthly pdf reports online (which exclude Spokane City and a handful of other small jurisdictions in the county).
5. Tacoma – the City releases an incident-based dataset for download, unsure how often updated.
Together, these jurisdictions contain about 40% of the WA state population.
More information and links to all of the data sources may be found in the detailed report here: https://rpubs.com/moxbox/wa_crime
Scary, right?
But … is crime really rising in WA? The short answer: the evidence doesn’t support this claim.
- For 2021, we only have crime data available for a handful of jurisdictions. They do not indicate an overall uptick in crime, just a mix of increases and decreases across and within jurisdictions, like we see in most years.
- There was a small uptick in crime in 2020 that coincided with national trends, but this occurred a year before the 2021 police reforms were enacted. Despite the uptick, Washington crime rates in 2020 remained at historically low levels.
Let’s take a closer look at the data.
1. First up: The statewide data for 2021 is not yet available.
Why is this?
Because there is a long process of collecting the data from all law enforcement agencies around the state, organizing it, and making it available to the public. (See more details in the “Data Appendix” section at the end of the blog.)
This means no one can say yet what happened to crime rates in Washington State in 2021. When someone claims otherwise, you should ask them what data they are referring to.
2. “But, don’t we know that crime rose last year? I’m sure I saw that in the news.”
The uptick that made the news last year happened in 2020, over a year before the police reform legislation took effect. (Remember, there is a long lag in reporting crime rate data for the state, so in 2021 we were hearing about data from 2020).
So what did 2020 look like? (see Figure 1)
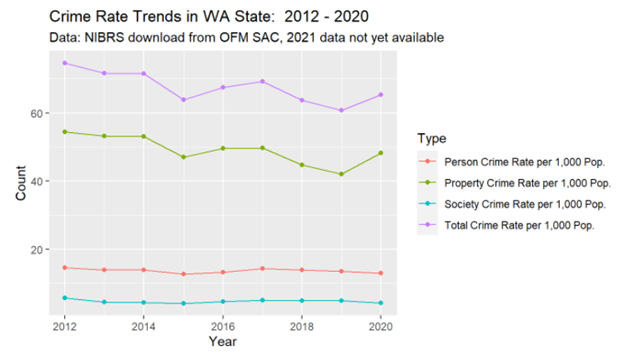
- There was a slight uptick in crime in 2020, driven by a rise in property crimes, but crimes against persons (which includes all violent crimes) and against society (such as drug crimes and commercial sex crimes) both declined slightly.
- Even with the uptick, Washington crime rates in 2020 were still at some of the lowest levels in recent years.
Figure 1. WA State Crime rates
- The top line is the total crime rate per 1,000 persons in WA (in 2020, the state population was about 7.6M persons)
- The other 3 lines are the breakdowns of that total into the 3 traditional categories used to define types of crimes: property (e.g., burglary, vandalism, arson), person (e.g., homicide, rape, robbery), and society (e.g., drugs, weapons violations, commercial sex)
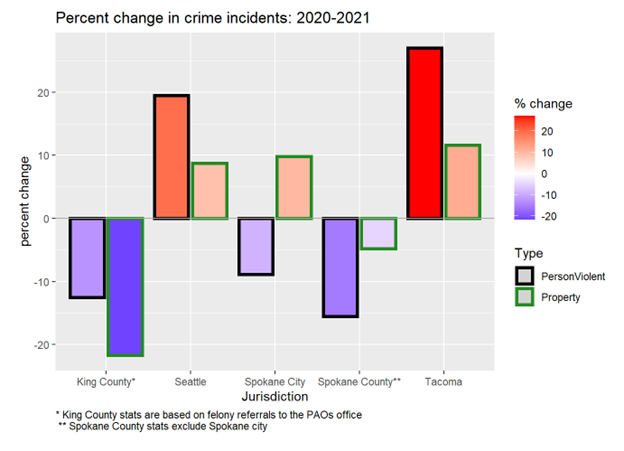
And what can we see from these jurisdictions? (see Figure 2)
- Both decreases and increases in crime, of similar magnitude, with some jurisdictions showing a mix. This is the typical pattern we see in year-to-year changes in crime rates.
- Note that even if a crime category increased, there may still be a mix of trends for specific crimes. For example, in Seattle, crimes against persons increased overall, but homicides declined by 25% and the rise in aggravated assaults is part of a trend that started in 2008 and cannot be attributed to last year’s police reforms
- Tacoma is the jurisdiction where crime appears to be increasing almost across the board. The details can be found in the full report https://rpubs.com/moxbox/wa_crime.
- Bars show the percent change for person (black outline) and property (green outline) crimes (the only data released).
- Increases are in pink/red, decreases are in purple/blue.
Bottom line: There is no evidence that crime is “skyrocketing” in Washington State.
- The uptick from 2020 was modest, affected property crimes only, and still left crime rates in Washington at some of the lowest levels seen in recent years. The uptick was part of a national trend, and happened a year before the legislation, so recent police reform efforts could not have caused it.
- The overall statewide data for 2021 are not yet available and won’t be for some months. But the data we can see from 2021 do not indicate an overall rise in crime, just a mix of increases and decreases across and within jurisdictions. This is the kind of pattern we typically see each year.
- The evidence does suggest that some specific jurisdictions (like Tacoma) are experiencing an increase in crime. This suggests we need to focus on the circumstances that are driving up crime in specific jurisdictions, not roll back police reforms statewide.
Data Appendix
Statewide crime data for Washington State are released by different organizations, as noted below. The lag in the public release ranges from 4 to 12 months after the year has closed.
- The agency responsible for aggregating the statewide data is the Washington Association of Sheriffs and Police Chiefs (WASPC). Reporting to WASPC is voluntary, but most (235 out of 275) law enforcement agencies in the state participate, sending their crime data to WASPC on a monthly basis. WASPC performs some basic error checking and forwards the data to the FBI, as part of the Uniform Crime Reporting system (UCR, https://www.fbi.gov/services/cjis/ucr/). WASPC also writes up a comprehensive annual report (~600+ pages!) around 4 months after the previous year has closed and posts this on their website here: https://www.waspc.org/crime-statistics-reports. But they do not provide public access to the data.
- The FBI also releases online reports, and, in addition, provides public access to preset tables and a downloadable incident-based dataset here: https://crime-data-explorer.app.cloud.gov/pages/home. The downloadable data are released about 12 months after the previous year has closed.
- As part of the Access Washington initiative, the WA State Office of Financial Management Statistical Analysis Center (OFM-SAC) provides public access to data dashboard (https://sac.ofm.wa.gov/sites/default/files/public/cjdb/nibrs.html), and a downloadable summary dataset that breaks down the crime counts by jurisdiction and county, merges on the official population estimates for those geographic locations, and computes crime rates per 1,000 population for each location. These data are released about 10 months after the previous year has closed.
Data for 2021 are limited to the jurisdictions that provide public access to the data before they are published by the sources above.We found 5 such jurisdictions in WA state:
1. King County – The KC Prosecuting Attorney releases monthly data on felony referrals.
2. Seattle Police Department – releases quarterly summary data on crimes (downloadable).
3. Spokane City Police Department – releases monthly “Compstat” pdf reports online.
4. Spokane County Sheriff’s office – releases monthly pdf reports online (which exclude Spokane City and a handful of other small jurisdictions in the county).
5. Tacoma – the City releases an incident-based dataset for download, unsure how often updated.
Together, these jurisdictions contain about 40% of the WA state population.
More information and links to all of the data sources may be found in the detailed report here: https://rpubs.com/moxbox/wa_crime